Robert Buchsbaum, Mass Audubon Staff Scientist
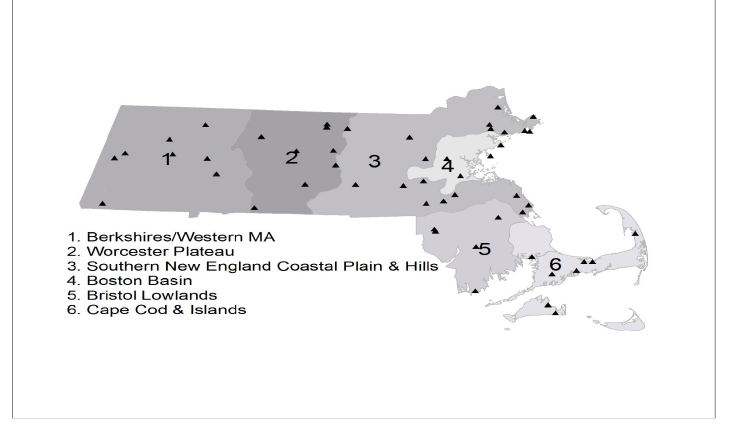
Fig. 1. Ecoregions of Massachusetts modified from The Nature Conservancy's ecoregional data available from the Massachusetts Office of Geographic Information (MassGIS). Triangles are locations of Mass Audubon properties that were included in these surveys.
In 2004, Mass Audubon's Conservation Science Department initiated an effort to assess the status of breeding birds on our sanctuaries. Since Mass Audubon sanctuaries are located in all parts of the Commonwealth, from Cape Cod through the Berkshires, this would provide an excellent assessment of the status of breeding birds throughout Massachusetts. A major impetus for the surveys has been to provide a baseline inventory of the species and numbers of birds currently breeding on our sanctuaries, allowing us to track future changes in bird populations due to factors such as global warming, suburban sprawl, invasive species, natural succession, and other changes in the landscape. Another goal is to evaluate how closely our sanctuaries represent the biodiversity of the entire state by comparing what occurs on our sanctuaries with records for all of Massachusetts. Finally, having a baseline would help us evaluate the impact of management measures, such as brush cutting to enhance early successional habitat.
We used point counts, a standard protocol in which observers stand in the middle of a circle and record all birds seen or heard within and outside the circle for ten minutes. The radii of the circles were 50 meters in forests, shrublands, and small fields and 100 meters in open habitats such as large fields and salt marshes. Surveys were carried out three mornings in June, the height of breeding activity in Massachusetts. Multiple circles were set up on each of our larger properties, and each circle contained one type of habitat (e.g., forest, grassland). Having a set size for each circle allows us to compare the species richness (number of species) and abundances for circles of the same habitat type. We currently have over 300 of these counting circles on 48 Mass Audubon properties.
For some of the discussion that follows, we have classified each sanctuary into one of six ecoregions (Figure 1). Ecoregions are large landscape units characterized by a similarity in climate, geology, physiography, and characteristic species assemblages. Because we have fewer results from the western part of the state, we ended up pooling all sanctuaries west of the Connecticut River into a Berkshires/Western MA ecoregion.
As of 2018, we have recorded 149 of the 218 species that are known to breed in Massachusetts during these surveys. The 218 species figure is taken from the results of the last Breeding Bird Atlas (Walsh and Petersen 2013). The 149 species were based on observations made within and beyond the point count circles. This does not mean that all 149 species are breeding on our sanctuaries, but rather that they are likely breeding somewhere in the area of the sanctuary and at a minimum passed through our counting circles during a survey. Some of the species that are missing from our list are birds that are not likely to be recorded by our point count surveys. These include owls, Whip-poor-Wills, and other nocturnal species. Other missing species that our methods did not capture are colonial and beach-nesting water birds, such as wading birds and Piping Plovers. Nonetheless, 25 of the 49 species that are listed as conservation priorities under the State Wildlife Action Plan (SWAP) were recorded in these surveys. Sanctuaries in the Cape Cod and Islands and the Southern New England Coastal Plain and Hills ecoregions, both in the eastern part of the state, had the largest overall numbers of species and SWAP species (Table 1). This could be due to the diversity afforded by coastal locations but they also had more sampling.
| Sanctuary |
Town |
Ecoregion |
# Species |
# SWAP Species |
Years Sampled |
| Allens Pond |
Dartmouth |
Bristol Lowlands |
91 |
26 |
12 |
| Arcadia |
Easthampton |
Connecticut River |
33 |
5 |
13 |
| Ashumet Holly |
Falmouth |
Cape Cod and Islands |
46 |
2 |
3 |
| Assonet Cedar Swamp |
Lakeville |
Bristol Lowlands |
48 |
6 |
3 |
| Attleboro Springs |
Attleboro |
Bristol Lowlands |
54 |
8 |
5 |
| Barnstable Great Marsh |
Barnstable |
Cape Cod and Islands |
44 |
7 |
2 |
| Boston Nature Center |
Boston |
Boston Basin |
31 |
3 |
3 |
| Broad Hill |
Holliston |
So New England Coastal Plain/Hills |
41 |
6 |
3 |
| Broad Meadow Brook |
Worcester |
So New England Coastal Plain/Hills |
75 |
12 |
9 |
| Broadmoor |
Natick |
So New England Coastal Plain/Hills |
63 |
8 |
5 |
| Canoe Meadows |
Pittsfield |
Berkshires/Western MA |
70 |
8 |
3 |
| Cedar Pond |
Wenham |
Boston Basin |
48 |
9 |
5 |
| Cheshire Pond |
Ashburnham |
Worcester Plateau |
31 |
6 |
3 |
| Daniel Webster |
Marshfield |
So New England Coastal Plain/Hills |
61 |
11 |
7 |
| Drumlin Farm |
Lincoln |
So New England Coastal Plain/Hills |
73 |
8 |
11 |
| Eagle Lake |
Holden |
Worcester Plateau |
44 |
7 |
3 |
| Eastern Point |
Gloucester |
So New England Coastal Plain/Hills |
39 |
6 |
4 |
| Edgartown Great Pond |
Edgartown |
Cape Cod and Islands |
26 |
2 |
3 |
| Elm Hill |
Brookfield |
Worcester Plateau |
55 |
7 |
4 |
| Endicott |
Wenham |
Boston Basin |
53 |
5 |
14 |
| Felix Neck |
Edgartown |
Cape Cod and Islands |
39 |
6 |
3 |
| Flat Rock |
Fitchburg |
So New England Coastal Plain/Hills |
51 |
11 |
3 |
| Graves Farm |
Williamsburg |
Berkshires/Western MA |
33 |
5 |
13 |
| Great Neck |
Wareham |
Cape Cod and Islands |
61 |
10 |
3 |
| Habitat |
Belmont |
Boston Basin |
61 |
8 |
12 |
| High Ledges |
Shelburne |
Berkshires/Western MA |
48 |
7 |
3 |
| Ipswich River |
Topsfield |
So New England Coastal Plain/Hills |
77 |
15 |
6 |
| Lake Wampanoag |
Gardner |
Worcester Plateau |
59 |
9 |
3 |
| Laughing Brook |
Hampden |
Berkshires/Western MA |
44 |
5 |
3 |
| Lime Kiln Farm |
Sheffield |
Berkshires/Western MA |
56 |
6 |
3 |
| Long Pasture |
Barnstable |
Cape Cod and Islands |
49 |
11 |
3 |
| Marblehead Neck |
Marblehead |
Boston Basin |
53 |
9 |
15 |
| Moose Hill |
Sharon |
So New England Coastal Plain/Hills |
72 |
11 |
9 |
| Museum of American Bird Art |
Canton |
So New England Coastal Plain/Hills |
33 |
2 |
4 |
| Nahant Thicket |
Nahant |
Boston Basin |
17 |
1 |
1 |
| Nashoba Brook |
Westford |
So New England Coastal Plain/Hills |
30 |
4 |
3 |
| Norman's Woe |
Gloucester |
So New England Coastal Plain/Hills |
10 |
0 |
1 |
| North Hill Marsh |
Duxbury |
So New England Coastal Plain/Hills |
45 |
4 |
3 |
| North River |
Marshfield |
So New England Coastal Plain/Hills |
31 |
3 |
3 |
| Oak Knoll |
Attleboro |
Bristol Lowlands |
49 |
6 |
3 |
| Pleasant Valley |
Lenox |
Berkshires/Western MA |
61 |
8 |
3 |
| Roads End |
Worthington |
Berkshires/Western MA |
43 |
5 |
3 |
| Rough Meadows |
Rowley |
So New England Coastal Plain/Hills |
82 |
20 |
15 |
| Rutland Brook |
Petersham |
Worcester Plateau |
53 |
7 |
3 |
| Skunknett River |
Barnstable |
Cape Cod and Islands |
34 |
2 |
4 |
| Stony Brook |
Norfolk |
Bristol Lowlands |
62 |
7 |
7 |
| Stump Brook |
Halifax |
Bristol Lowlands |
51 |
4 |
4 |
| Wachusett Meadow |
Princeton |
Worcester Plateau |
58 |
11 |
3 |
| Waseeka |
Hopkinton |
So New England Coastal Plain/Hills |
42 |
3 |
5 |
| Wellfleet Bay |
Wellfleet |
Cape Cod and Islands |
59 |
14 |
15 |
| West Mountain |
Plainfield |
Berkshires/Western MA |
38 |
4 |
3 |
| Whetstone Woods |
Wendell |
Worcester Plateau |
60 |
9 |
3 |
Table 1. Mass Audubon wildlife sanctuaries surveyed during this project, the number of all species, the number of SWAP species recorded, and the number of years sampled during breeding bird surveys. Arcadia and Graves Farms lists based on spot mapping done from 2004–2016 by D. McLain. All other lists were derived from point counts.
Forest Birds
A closer look allows us to compare which birds breed most frequently at different sanctuaries, different ecoregions of the Commonwealth, and different habitats. We had the most data for forest habitat, with 236 circles on 47 properties in forested habitats in all ecoregions. We pooled the sanctuaries into their ecoregions and calculated the percentage of observations in each ecoregion where each species of birds was encountered (Table 2).
| Species |
All regions |
Berkshires Western MA |
Worcester Plateau |
Southern New England Plain and Hills |
Boston Basin |
Bristol Lowlands |
Cape Cod and Islands |
| Ovenbird |
44% |
74% |
69% |
40% |
13% |
48% |
19% |
| BC Chickadee |
42% |
43% |
39% |
36% |
51% |
33% |
50% |
| RE Vireo |
26% |
74% |
43% |
15% |
12% |
12% |
1% |
| Tufted Titmouse |
25% |
15% |
17% |
0% |
47% |
40% |
32% |
| Blue Jay |
22% |
23% |
16% |
24% |
33% |
13% |
22% |
| Am Robin |
22% |
15% |
3% |
19% |
63% |
12% |
18% |
| Pine Warbler |
20% |
3% |
6% |
25% |
26% |
19% |
39% |
| E. Wood Pewee |
18% |
25% |
21% |
21% |
16% |
15% |
9% |
| Gray Catbird |
17% |
4% |
1% |
13% |
35% |
21% |
30% |
| White B Nuthatch |
16% |
11% |
7% |
25% |
18% |
22% |
12% |
| D Woodpecker |
15% |
10% |
6% |
14% |
20% |
27% |
17% |
| Am Goldfinch |
15% |
9% |
6% |
15% |
21% |
12% |
30% |
| Scarlet Tanager |
14% |
24% |
26% |
16% |
6% |
14% |
0% |
| Common Grackle |
12% |
0% |
2% |
7% |
46% |
5% |
15% |
| Veery |
12% |
32% |
17% |
8% |
0% |
16% |
0% |
| Wood Thrush |
11% |
25% |
2% |
8% |
17% |
13% |
0% |
| N Cardinal |
10% |
1% |
0% |
12% |
27% |
8% |
13% |
| GC Flycatcher |
10% |
4% |
7% |
11% |
20% |
8% |
11% |
| BH Cowbird |
9% |
16% |
4% |
9% |
7% |
12% |
10% |
| BT Green Warbler |
9% |
29% |
23% |
1% |
0% |
3% |
0% |
| E Towhee |
8% |
0% |
1% |
11% |
3% |
8% |
28% |
Table 2. Frequency of occurrence in forested habitats of the 21 most common bird species on Mass Audubon properties. Species are listed in descending order of frequency across the entire state.
Across the state, Ovenbirds and Black-capped Chickadees were the most frequently encountered species (Table 2, All Regions column). Well known to all birder is that certain species are more likely to be found in forests in the western part of the state, others in the eastern part, and still others occur everywhere. Our results bear this out (Table 2). Ovenbirds, Red-eyed Vireos, Scarlet Tanagers, and Black-throated Green Warblers were most frequently encountered in the forests of the ecoregions in the central and western parts of the state, whereas Pine Warblers, Gray Catbirds, and Eastern Towhees dominated in the east.
The coefficient of variation (CV) is a measure of how variable a species was among the different ecoregions (Table 3). A low CV means that a bird is encountered at similar rates in the different ecoregions, thus it is relatively evenly distributed among the ecoregions. A high CV indicates that the bird varies substantially from one region to another. The results are, for the most part, consistent with what we know about the different species of birds. Black-capped Chickadee had the lowest CV of all the species. This means that our state bird is fairly evenly distributed across all ecoregions, which certainly agrees with everyone's experience of it. Blue Jays and, surprisingly, Eastern Wood Pewees were also relatively evenly distributed across the state. Common Grackles and Black-throated Green Warblers had the highest variation of any of the birds in our list because their occurrences were skewed toward only a few regions—the Boston Basin on the part of Grackles and the sanctuaries in the central and western part of Massachusetts for Black-throated Green Warblers. Red-eyed Vireo was another species more frequently encountered in the western part of the state. In contrast, Eastern Towhees were particularly abundant in the Cape Cod and Islands ecoregion and almost totally absent from the western Massachusetts ecoregions.
| Species |
CV |
Regions most commonly occurring |
| Common Grackle |
141% |
Boston Basin |
| BT Green Warbler |
141% |
Berkshires/ Western MA, Worcester Plateau |
| E. Towhee |
128% |
Cape Cod and Islands |
| RE Vireo |
105% |
Berkshires/Western MA, Worcester Plateau |
| Veery |
101% |
Berkshire/W MA, Worcester Plat, Bristol Lowlands |
| Robin |
98% |
Boston Basin |
| No. Cardinal |
96% |
Boston Basin |
| Wood Thrush |
86% |
Berkshire/Western MA, Boston Basin |
| Gray Catbird |
79% |
Boston Basin, Bristol Lowlands |
| Scarlet Tanager |
71% |
Berkshires/ Western MA, Worcester Plateau |
| T. Titmouse |
70% |
Boston Basin, Bristol Lowlands, Cape Cod & Islands |
| Pine Warbler |
69% |
So NE Coastal Plain, Boston Basin, Cape Cod & Islands |
| Am. Goldfinch |
59% |
Cape Cod & Islands |
| Ovenbird |
57% |
Everywhere except Boston Basin, Cape Cod & Islands |
| GC Flycatcher |
54% |
Boston Basin |
| Downy Woodpecker |
49% |
Boston Basin, Bristol Lowlands |
| BH Cowbird |
44% |
Berkshires/Western MA |
| WB Nuthatch |
44% |
So NE Coastal Plain, Bristol Lowlands |
| E. Wood Pewee |
33% |
All over |
| Blue Jay |
31% |
All over |
| BC Chickadee |
18% |
All over |
Table 3. Amount of variation (Coefficient of Variation, CV) among the regions for the forest birds listed in Table 2. A high CV means that the bird's distribution varies greatly across ecoregions of the state; a low CV means that the bird is relatively evenly distributed across the regions. Birds are listed in order from high CV to low CV.
In addition to counting the birds, we also characterized the vegetation in each forest circle. We classified our forested sites into four types based on tree canopy composition determined from field observations: Deciduous (all broad-leaved trees that drop their leaves in the fall), Deciduous-Evergreen (greater than 50% broad-leaved trees), Evergreen-Deciduous (greater than 50% conifer trees), and Evergreen (all conifer trees such as pines, hemlocks, or spruce). Each circle was classified as one forest type. We analyzed the association of forest birds with different forest types. We included 130 forest circles in this analysis.
| Deciduous (19 %) |
Deciduous-Evergreen (52 %) |
Evergreen-Deciduous (18 %) |
Evergreen (4 %) |
| Red-eyed Vireo |
Wood Thrush |
American Redstart |
Black-throated Green Warbler |
| Scarlet Tanager |
|
Red-breasted Nuthatch |
Blackburnian Warbler |
| |
|
|
Black and White Warbler |
Table 4. Forest birds that showed a strong preference for certain forest types. The numbers in parentheses are the percentage of circles containing that forest type.
Preference was determined by comparing the percentage of birds in each forest type with the availability of those types (percentage of circles having that forest type). If a bird showed no preference, then its percentage occurrence among the four canopy types should be similar to the percentage of forest types available. Red-eyed Vireos and Scarlet Tanagers were present in deciduous canopy more than the availability of that forest type (Table 4). Black-throated Green, Blackburnian, and Black and White warblers showed the strongest affinity for evergreen canopies. Black-throated Blue Warblers were present in Deciduous and Evergreen circles more than in Deciduous-Evergreen and Evergreen-Deciduous forest types. Note that the number of purely evergreen (coniferous) circles was less common than the other types; one rarely finds pure stands of white pines or hemlocks in Massachusetts without at least some broad-leaved trees mixed in.
Salt Marshes
One of the advantages of this study has been an ability to delve into the status and trends of some birds of conservations concern. Salt marsh birds are high on this list. Their vulnerability to ongoing and more severe, future sea level rise was well documented in Mass Audubon's third State of the Birds Report (Walsh and Severson 2017). The Saltmarsh Sparrow has become a poster child for the effects of sea level rise on birds that nest in salt marshes, but it is not the only species that lives in this challenging habitat. Seaside Sparrows, Willets, and Clapper Rails as well as Saltmarsh Sparrows are all listed on the State Wildlife Action Plan.
| Species |
Allens Pond |
Barnstable Great Marsh |
Eastern Point |
Great Neck |
Rough Meadows |
Wellfleet Bay |
| Saltmarsh Sparrow |
1.16 |
0.00 |
0.00 |
0.00 |
0.42 |
0.34 |
| Seaside Sparrow |
0.54 |
0.00 |
0.00 |
0.00 |
0.00 |
0.00 |
| Willet |
0.87 |
0.00 |
0.00 |
0.00 |
0.08 |
0.35 |
| Red-winged Blackbird |
0.58 |
0.70 |
4.19 |
0.18 |
0.30 |
0.09 |
Table 5. Abundances of three obligate salt marsh nesting birds (Saltmarsh and Seaside sparrows, Willet, and another common inhabitant of the marshes (Red-winged Blackbird). Numbers are the average numbers of each species per hectare (1 ha= approximately 2.5 acres).
We carried out breeding bird surveys on six sanctuaries that have at least some salt marsh circles (Table 5). Three contained some obligate salt marsh birds and three did not. Two of the three sanctuaries that lacked obligate salt marsh species are likely too small to attract these specialists. The salt marsh at Eastern Point is seven acres (approximately three hectares) and the marsh at Great Neck Wildlife Sanctuary is three acres. On the other hand, Barnstable Great Marsh Wildlife Sanctuary is part of one of the Commonwealth's largest salt marshes, so its lack of any obligate marsh species is surprising. Of the three sanctuaries that did contain obligate salt marsh species, Allens Pond Wildlife Sanctuary in South Dartmouth, had almost three times the density of Saltmarsh Sparrows of the other two sanctuaries, more than twice the Willet concentrations, and was the only sanctuary that had Seaside Sparrows within counting circles. The volunteers who sampled at Allens Pond, were also treated to three records of Clapper Rails, one of a King Rail, and occasional late-lingering migratory shorebirds.
Allens Pond and Rough Meadows Wildlife sanctuaries have benefited from almost yearly surveys by staff and volunteers since 2004. Rough Meadows is part of the Great Marsh ecosystem of northeastern Massachusetts and abuts the Parker River National Wildlife Refuge. Saltmarsh Sparrow numbers at Rough Meadows vary a great deal from year to year but they do not seem to be suffering from the consistent downward trend that is happening in other parts of its range, particularly in Connecticut and the Mid Atlantic states (see results of SHARP project summarized in Walsh and Servison 2017). Nonetheless, with the anticipated continuation of rising sea levels, the future of this obligate salt marsh species is tenuous at Rough Meadows and throughout its range.
Allens Pond Wildlife Sanctuary provided a unique opportunity to study the effect of the temporary loss of salt marsh vegetation on the obligate salt marsh breeding birds, providing perhaps a hint of what might happen with rising sea levels. In 2008, the marsh was inundated for about six months during the breeding season when the inlet that connects the pond to Buzzard's Bay closed. This prevented the pond and its adjacent marshes from draining at low tide, killing much of the native marsh grasses. In the years before the marsh vegetation died off, we had been monitoring the birds and could document how the loss of vegetation affected them. There was a precipitous decline in Saltmarsh and Seaside sparrows and Willets in the years immediately following the event even after the inlet was reopened. The good news is that after about five years, all three species and the salt marsh vegetation recovered to roughly their "pre-flood" numbers.
A. 100 m radius circles—large fields
| SPECIES |
#/ha |
| Tree Swallow |
1.00 |
| Bobolink |
0.60 |
| Red-winged Blackbird |
0.57 |
| Starling |
0.21 |
| Common Yellowthroat |
0.16 |
| American Goldfinch |
0.13 |
| Song Sparrow |
0.12 |
| Common Grackle |
0.11 |
| Eastern Bluebird |
0.09 |
| Cedar Waxwing |
0.09 |
B. 50 m radius circles—small fields
| SPECIES |
#/ha |
| species |
#/ha |
| Red-winged Blackbird |
0.97 |
| Song Sparrow |
0.60 |
| American Goldfinch |
0.46 |
| Tree Swallow |
0.41 |
| Common Grackle |
0.39 |
| Common Yellowthroat |
0.29 |
| Starling |
0.28 |
| Gray Catbird |
0.26 |
| Cedar Waxwing |
0.26 |
| Bobolink |
0.17 |
Table 6. Abundance per hectare of the 10 most abundant species from grassland habitats recorded in 100 m and 50 m radius breeding bird count circles. 1 ha= approximately 2.5 acres.
Birds of early successional habitats: Grasslands and Shrublands
An unambiguous message in Mass Audubon's first State of the Birds report (Mass Audubon 2011) was that many birds of grasslands and shrublands have declined over at least the past 40 years. Mass Audubon sanctuaries contain a variety of grassland habitats that were included in our Sanctuary Inventory and Monitoring Program; 21 grassland breeding bird census circles that have radii of 100 meters are located on 7 sanctuaries and 19 circles on 11 sanctuaries have 50-meter radii. The latter represent fields that were too small to fit the larger circles. Since many studies have shown that the area of grassland is a key to its ability to support grassland bird species, we have analyzed these two groups separately (Table 6a and b). Because of the smaller number of circles compared to forests, we have not attempted to compare grasslands of different ecoregions.
There clearly is a difference between the larger fields and the smaller fields. Most notably, Bobolinks were three times more dense and Tree Swallows twice as dense in the large fields. These species are targets of management measures, particularly in large fields. In contrast, Red-winged Blackbirds, Common Grackles, and Song Sparrows were roughly twice as dense in the small fields. These species likely benefit from the proximity of shrubland and woodlands that are characteristic of small fields.
Counting most birds in a field presents a particular challenge because they move around more than forest birds during a 10-minute counting period. Tree Swallow numbers were taken from estimates of the numbers that intersected the circle as they flew by in foraging trips during the 10-minute count period. Bobolinks, although not as frequently airborne as the swallows, moved around the circle quite a lot so observers had to use their best judgment of the number of individuals they were counting.
Neither large nor small fields contained a number of grassland species of conservation concern, i.e., Grasshopper Sparrows and Upland Sandpipers. Likely what we call a large field, such as the 250 acres at Daniel Webster Wildlife Sanctuary, is still not large enough to support the greatest diversity of grassland birds. In addition, the vegetation on these fields, which consists primarily of tall pasture grasses, may not be optimal for species like Grasshopper Sparrows. It is surprising that our number of Savannah Sparrows, which is presumably less area-sensitive than other grassland species, was relatively low in both large and small fields.
| Species |
#/ha |
| Gray Catbird |
1.44 |
| Yellow Warbler |
0.90 |
| Song Sparrow |
0.85 |
| American Robin |
0.77 |
| Black-capped Chickadee |
0.64 |
| American Goldfinch |
0.59 |
| Common Yellowthroat |
0.58 |
| Baltimore Oriole |
0.58 |
| Eastern Towhee |
0.55 |
| Red-winged Blackbird |
0.55 |
Table 7. The ten most abundant birds in shrubland at Mass Audubon sanctuaries.
We also had eleven circles in shrublands in seven sanctuaries (Table 7). The most common birds were Gray Catbird, Yellow Warbler, and Song Sparrow, all well-known denizens of shrubby habitats. Eastern Towhee, a SWAP species, was ninth most abundant. Sad to say, we did not record a single Brown Thrasher within any of our shrubland circles, although we did get a few in shrubland outside circles.
| Species |
#/ha |
| Red-winged Blackbird |
4.11 |
| Common Grackle |
1.88 |
| Tree Swallow |
1.05 |
| Common Yellowthroat |
0.84 |
| European Starling |
0.75 |
| Gray Catbird |
0.70 |
| Song Sparrow |
0.67 |
| Yellow Warbler |
0.52 |
| Swamp Sparrow |
0.43 |
| Baltimore Oriole |
0.29 |
Table 8. The ten most abundant birds observed in freshwater wetlands on Mass Audubon sanctuaries during our breeding bird surveys.
Freshwater Wetlands
Our sanctuaries contain a variety of freshwater wetlands such as shrub swamps, red-maple swamps, cedar swamps, and wet meadows. We set up seventeen wetlands circles on seven sanctuaries. Pooling all the different types of wetlands together, it is clear that Red-winged Blackbirds are by far the most abundant species in our wetlands (Table 8). Grackles, Tree Swallows, and Common Yellowthroats were also common in wetlands. Of the more cryptic freshwater wetland birds, we have a number of records of Soras and one of a Common Moorhen at Ipswich River, and records of Virginia Rails at Canoe Meadows, Broad Meadow Brook, Stony Brook, and Stump Brook.
One of the limitations of our study is that the mere presence of a bird in a habitat during the breeding season does not mean it is actually breeding in that circle or in the immediate surrounding area. Thus, the common occurrence of grackles and starlings in wetlands during our breeding surveys indicates only that they were present in the area. To properly interpret this information we need to combine our observations with what we know about the life history of each species.
SWAP species in terrestrial habitats
| Chimney Swift |
6 |
| Eastern Towhee |
6 |
| Wood Thrush |
6 |
| Black-and-white Warbler |
5 |
| Black-billed Cuckoo |
5 |
| Blue-winged Warbler |
5 |
| Scarlet Tanager |
5 |
Table 9. The ten most abundant birds observed in freshwater wetlands on Mass Audubon sanctuaries during our breeding bird surveys.
As mentioned above, species that are listed on the State Wildlife Action Plan are of high conservation concern, as determined by the Massachusetts Division of Fisheries and Wildlife. Wood Thrush and Scarlet Tanager were the SWAP species that occurred on the most Mass Audubon sanctuaries, each occurring in 35 of the 48 sanctuaries in this study. Eastern Towhee was recorded on about two-thirds of the sanctuaries and Black-and-white Warbler on a little over half. On the other hand, Northern Harrier, American Kestrel, Purple Martin, Cerulean Warbler, and Eastern Meadowlark were recorded on only one place, each at a separate sanctuary.
| Species |
#ecoregions |
Ecoregions present |
Comments |
| Ruffed Grouse |
2 |
Southern New England Coastal Plain and Hills, Worcester Plateau |
|
| Sharp-shinned Hawk |
2 |
Boston Basin, Worcester Plateau |
|
| Northern Parula |
2 |
Boston Basin, Bristol Lowlands |
|
| Northern Goshawk |
2 |
Berkshires, Southern New England Coastal Plain and Hills |
|
| Northern Bobwhite |
2 |
Cape Cod and Islands, Southern New England Coastal Plain and Hills |
|
| Mourning Warbler |
2 |
Boston Basin Bristol Lowlands |
|
| Purple Martin |
2 |
Southern New England Coastal Plain and Hills, Bristol Lowlands |
|
| Field Sparrow |
2 |
Cape Cod and Islands, Southern New England Coastal Plain and Hills |
|
| Eastern Meadowlark |
1 |
Southern New England Coastal Plain and Hills |
Occurred one year only at Daniel Webster |
| Northern Harrier |
1 |
Bristol Lowlands |
Only at Allens Pond |
| Cerulean Warbler |
1 |
Berkshires |
Only at High Ledges |
Table 10. Rare SWAP species. Bird recorded in only one or two ecoregions during the breeding season.
From an ecoregional perspective, three SWAP species were recorded in all six ecoregions and four occurred in five of the six ecoregions (Table 9). Scarlet Tanagers occurred on all (100%) of the sanctuaries in the Berkshire, Worcester Plateau, and Bristol Lowlands sanctuaries and were well represented in the Southern New England Coastal Plain and Hills (67%). The only ecoregion where this species was not recorded was Cape Cod and Islands. Wood Thrushes were well represented the Berkshires, the Southern New England Coastal Plain and Hills, and the Bristol Lowlands ecoregion but were not recorded on Cape Cod and Islands. On the other hand, three species were recorded from only one ecoregion (Table 10). Just as the presence of a bird in a breeding bird circle does not mean it is actually breeding in the vicinity, its absence does not mean that it is not breeding somewhere on the sanctuary beyond its detectability from a circle.
Future directions
As mentioned above, one of the motivations for these surveys was to get a baseline of current conditions so that we can examine future changes. Everyone who has done bird surveys knows how variable the results can be. Birds fly, which is, of course, great for the birds but challenging for getting consistent results from year to year and even within our three June surveys each year. When we miss a Wood Thrush we heard singing a week ago, does that mean it is no longer present, has temporarily occupied a different part of its territory, or is just being quiet for the 10 minutes of our survey? We need to be able to separate the signal from the noise in order to be able to detect real change. Using a simple statistical procedure and taking into account the variability in detection from survey to survey, we determined that we would need three years of surveys to be able to detect a 75% change in the numbers of Wood Thrushes at all of our sanctuaries. It would take 10 years to detect a 30% change. For Ovenbirds at one of our sanctuaries (Ipswich River), it would take three years to detect a change of 85%, and 10 years to detect a change of 35%. In sum, a commitment to long term monitoring is needed to detect relatively subtle changes in bird populations.
Acknowledgements
The surveys would have been impossible to carry out without the strong support of many Mass Audubon staff, interns, and volunteers. About 140 observers have contributed their observations to these surveys over the past 14 years. Although too many to list individually, their contributions are acknowledged here. A special thanks goes to members of the Young Birders Club who have been instrumental in surveys carried out at Moose Hill, Allens Pond, Attleboro Springs, and Oak Knoll. Another special thanks goes to staff and volunteers who have enthusiastically made continuous, annual records since 2004. Our original goal was to sample for three consecutive years every 10 years, so these particular staff and volunteers have gone way beyond the original plan and provide us with an invaluable long term data set.
References
- Mass Audubon. 2011. State of the Birds 2011. Lincoln, Massachusetts: Massachusetts Audubon Society.
- Walsh, J.M., and W.R. Petersen. 2013. Massachusetts Breeding Bird Atlas 2. Lincoln, Massachusetts: Massachusetts Audubon, (Published by Scott and Nix).
- Walsh, J. M., and M.S.V. Servison, (eds.) 2017. State of the Birds 2017: Massachusetts Birds and Our Changing Climate. Lincoln, Massachusetts: Massachusetts Audubon Society.
Robert Buchsbaum is the Greater Boston/North Shore Regional Conservation Scientist with Mass Audubon. He received his Bachelor of Science degree in Natural Resources from Cornell and his Ph.D. in Marine Ecology from the Boston University Marine Program, where he studied feeding selection by Canada Geese on salt marshes. In over 30 years at Mass Audubon, Buchsbaum has advised sanctuaries on ecological research, management, and education and has provided technical analysis to the organization on a variety of conservation issues. He is also responsible for coordinating Mass Audubon's statewide Sanctuary Inventory and Monitoring Program, of which the breeding bird surveys is a major component.